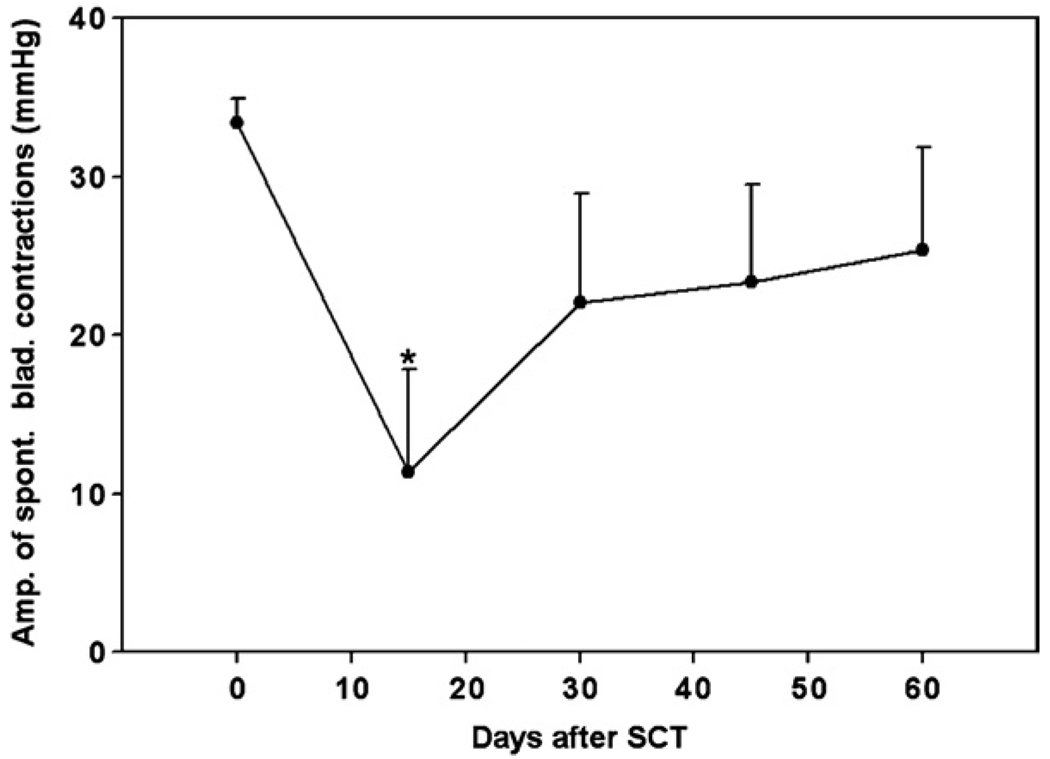
Figure 6.
Average amplitudes of spontaneous bladder contractions in three animals with complete SCT at the T12–T13 level. Error bars indicate standard deviations. The asterisk indicates significant difference (p < 0.05) from the pre-SCT value based on one-way repeated-measures ANOVA followed by Bonferroni’s multiple comparison post-hoc test.

