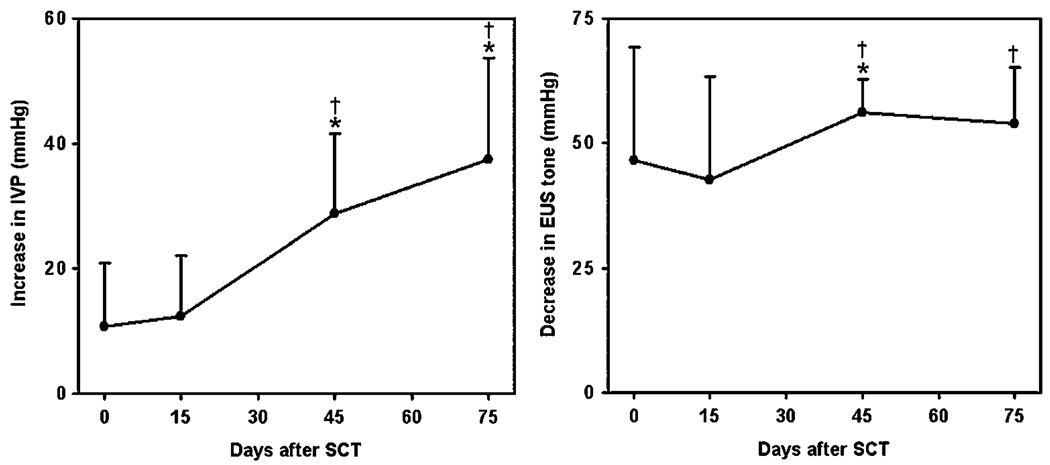
Figure 9.
Average increase in intravesical pressure (IVP) (left panel) and decrease in EUS pressure (EUSP) (right panel) in response to stimulation with individual electrodes in three SCT animals. IVP data were compiled from all nine electrodes in SP143, three electrodes in SP148 (7, 8, 9) and three electrodes in SP161 (3, 7, 8). EUS data were compiled from all nine electrodes in SP143, all nine electrodes in SP148 and nine electrodes in SP161 (2–9, 11). Error bars indicate standard deviations. Asterisks and daggers (†) indicate significant differences (p < 0.05) from values before SCT and 15 days post-SCT, correspondingly, based on one-way repeated-measures ANOVA followed by Bonferroni’s multiple comparison post-hoc test.

