
Fig. 6.
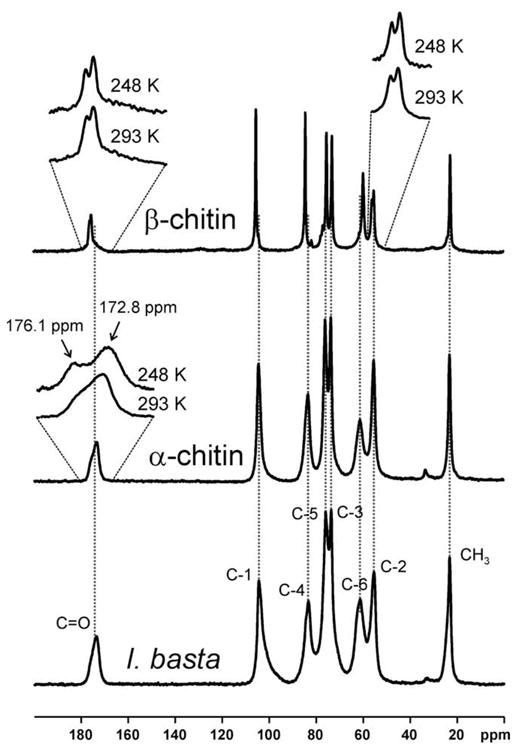
13C {1H} CP-MAS NMR spectra of β-chitin from T. rotula, α-chitin from crabs, and an I. basta scaffold after NaOH treatment and subsequent H2O2 purification measured at 293 K. Inserts: Selected signals measured at room temperature and at 248 K. Dashed vertical lines indicate the chemical shifts of the signals in α-chitin.