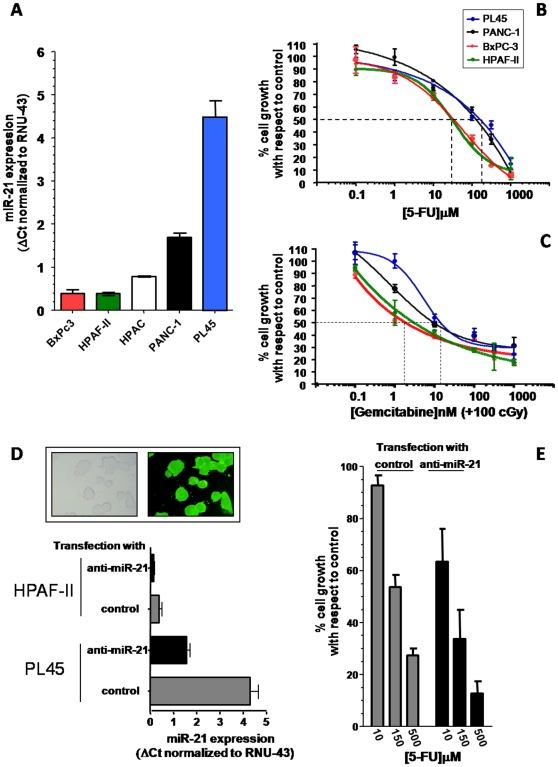
Figure 3. In vitro studies validating the role of miR-21 in PDAC chemosensitivity.
(A) MiR-21 expression in 5 PDAC cell lines. Expression was determined by quantitative PCR, using the delta Ct method with RNU-43 as reference and the values are in a.u.. (B–C) Representative curves of growth inhibitory effects of 5-FU (B) and gemcitabine plus radiotherapy (C), 48-hour drug exposure. (D). Cells were seeded at 104/well and the anti-proliferative effects were evaluated using the SRB assay, as described in the methods. The mean IC50 values for 5-FU (48 h continuous exposure) were as follows: 36.3 µM (BxPC-3), 30.9 µM (HPAF-II), 138.4 µM (PANC-1) and 174.2 µM (PL45); while the IC50 values for gemcitabine (in cells pre-treated with 100 cGray) were 2.1 nM (BxPC-3), 3.4 nM (HPAF-II), 10.2 nM (PANC-1) and 11.4 nM (PL45). (D) MiR-21 expression in HPAF-II and PL45 cells transfected with negative controls or with anti-miR-21 oligos. Transfection efficiency was evaluated by fluorescence microscopy as shown in the pictures in the upper panel, original magnification, x40 (E) Modulation of 5-FU antiproliferative effects in PL45 cells transfected with anti-miR-21 in comparison with control transfected cells. Columns, mean values obtained from three independent experiments; bars, SE, dashed lines, concentrations corresponding to 50% inhibition of cell growth with respect to control, i.e. IC50 values.

