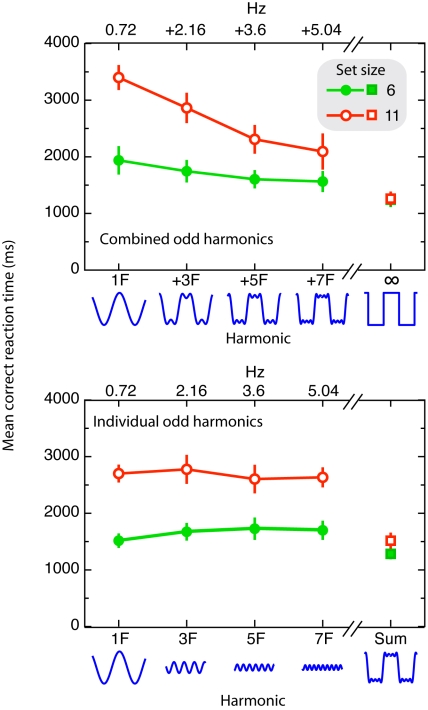
Figure 5. Results of Experiment 3.
The upper panel indicates the mean correct reaction time as a function of set size, and stimulus type for each combined odd harmonics. The lower panel indicates the mean correct reaction time as a function of set size, and stimulus type for each individual odd harmonics. The frequency for each individual odd harmonic is plotted on top of the graphs. Overall, adding higher odd harmonics to a fundamental sine-wave increases search efficiency, even though those harmonics alone afford no search benefit.

