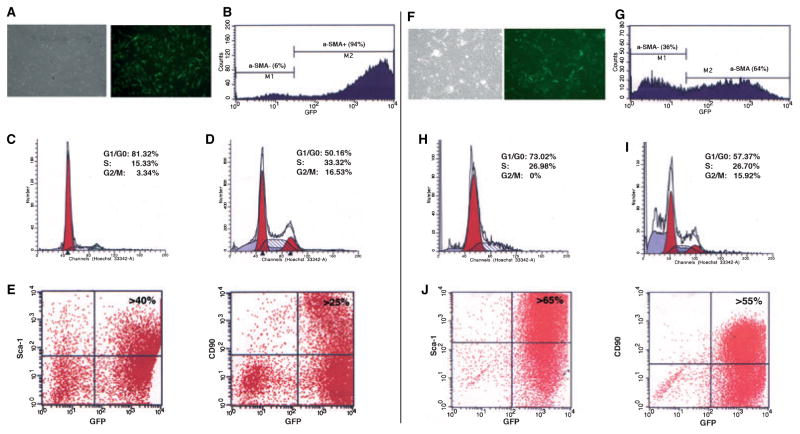
Fig. 6.
Phenotype of α-smooth muscle actin–green fluorescent protein (αSMA–GFP)-positive cells derived from primary murine dental follicle (mDF) and murine periodontal ligament (mPDL) cultures. (A) Transmitted and epifluorescence images of primary mDF cultures on day 7, and (B) fluorescence-activated cell sorter analysis revealed that a high proportion of cells express αSMA–GFP (> 90%). The histogram of cell cycle analysis was performed for αSMA–GFP− cells and αSMA–GFP+ cells, indicated in Fig. 5B as M1 and M2 gated populations. (D) Three-day-old αSMA–GFP+ mDF cells underwent a high division rate, with > 30% of cells in the S phase of the cell cycle and > 15% of cells in the G2M phase of the cell cycle, while the αSMA–GFP− population (C) showed a very limited potential for cell division. (E) A high proportion of αSMA–GFP+ cells expressed Sca-1 (> 40%) and CD90 (> 25%). (F, G) The αSMA–GFP+ population represents about 60% of the primary mPDL culture on day 3. Similarly to mDF, αSMA–GFP+ cells derived from mPDL showed a high cell division rate, with > 25% of cells in the S phase of the cell cycle and > 15% of cells in the G2M phase of the cell cycle (I), while the αSMA–GFP− population (H) showed very few cells undergoing cell division. (J) More than 65% of mPDL cells expressed Sca-1 and > 55% were positive for CD90. Representative plots are shown after the CD45− population was excluded from analysis using CD45–APC staining.

