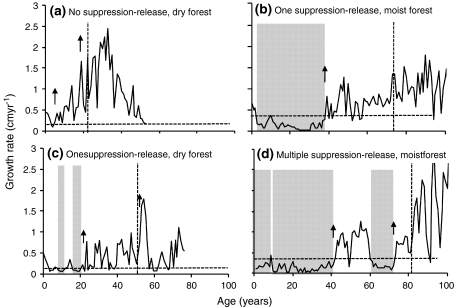
Fig. 3.
Examples of lifetime growth trajectories of C. odorata in two forests: a dry forest, direct growth; b moist forest, one suppression-release; c dry forest, one suppression-release; and d moist forest, multiple suppression-release. Threshold values for detecting suppressed growth periods are indicated by horizontal dashed lines, periods of suppression by shaded areas and release events by arrows. The vertical lines indicate age on reaching the canopy (i.e. at 15- and 30-cm diameter for dry and moist forests, respectively)

