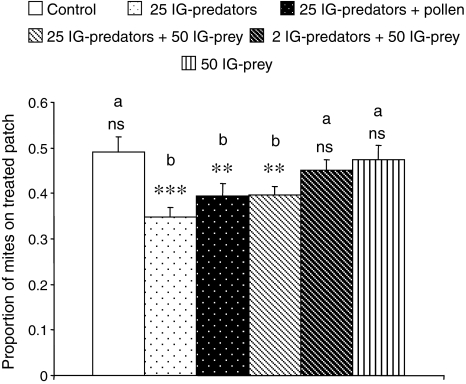
Fig. 2.
The initial proportion (+SEM) of IG-prey on the treated patch. See legend to Fig. 1 for further explanation. For each treatment, the observed distributions were tested against a random distribution (proportion of 0.5) with a t test: ns not significant; P > 0.05; **P < 0.005; ***P < 0.0001. Different letters above each bar indicate significant differences among the treatments (GLM, P < 0.0001)

