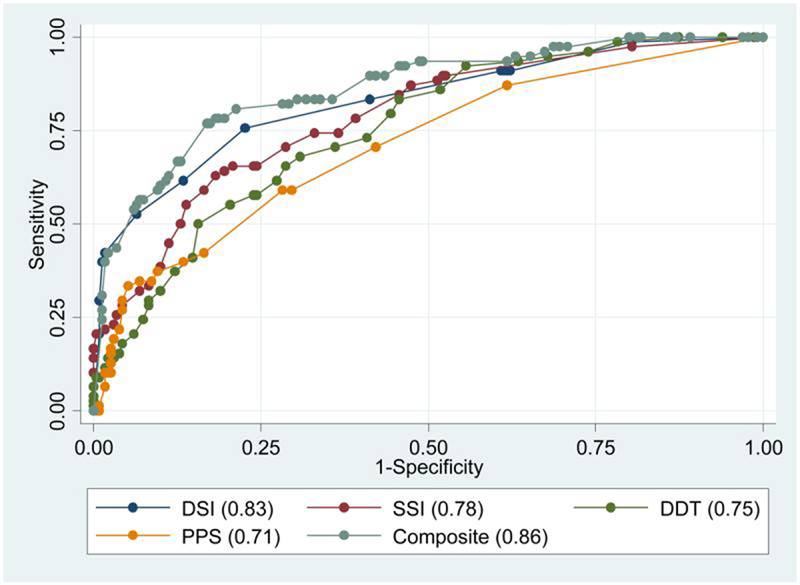
Fig. 1. ROC curves comparing the area under the curve for each CAP test.

The area under the curve (AUC) is shown for each test: DSI (area 0.83), SSI (area 0.78), DDT (area 0.75), PPS (area 0.71), and the Composite (lowest score on any of the 4 tests) score (area 0.86).
