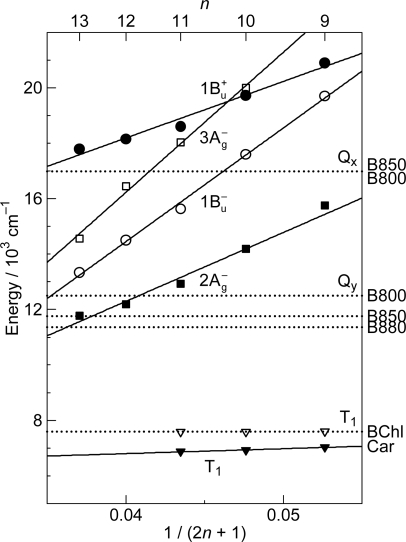
Figure 1.
Energies of the 1Bu+(0), 3Ag−(0), 1Bu−(0) and 2Ag−(0) vibronic levels of Cars (n = 9–13) determined by measurement of resonance-Raman excitation profiles and those of the T1 state determined by emission spectroscopy of Cars (n = 9–11) bound to the LH2 complexes. For comparison, the energies of the Qx and Qy transitions and of the T1 state of BChls in LH2 and LH1 complexes are also shown (Reproduced from Ref. [1]).

