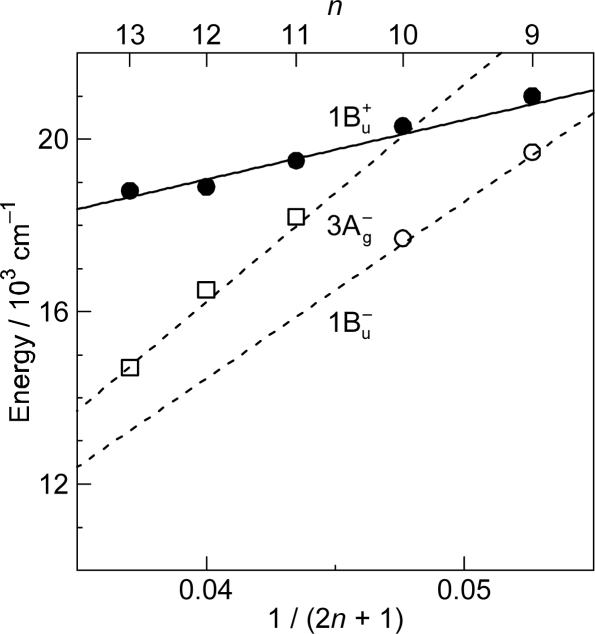
Figure 17.
The 1Bu+(0) energies of Cars (n = 9–13) in THF solution determined by conventional electronic-absorption spectroscopy as well as the 3Ag−(0) and 1Bu−(0) energies determined by the stimulated-emission peaks in Figure 16 and Figure 19, which are compared with the regression line determined by the RREP measurement of crystalline Cars (n = 9–13) (taken from Figure 1) (Reproduced from Ref. [16]).

