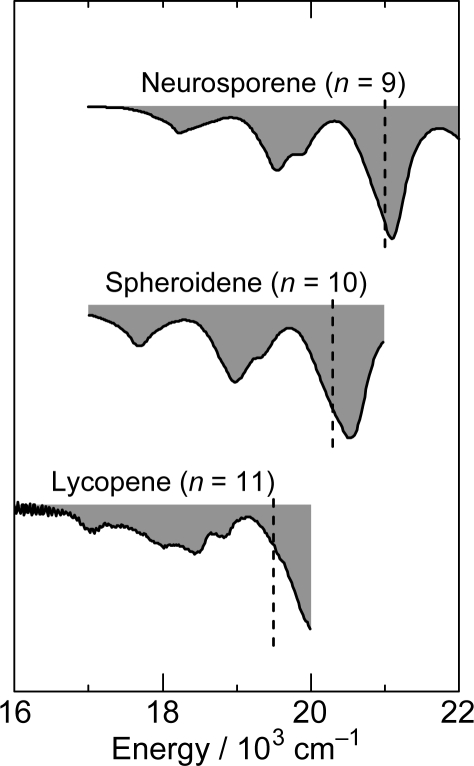
Figure 20.
A set of stimulated-emission patterns obtained by selective excitation with ∼100 fs pulses to the 1Bu+(0) level of Cars (n = 9–11) in nonpolar solvent (taken from Figure 10). They are to be compared with the stimulated-emission patterns obtained by coherent excitation with ∼30 fs pulses to the 1Bu+(0) level of the same set of Cars in THF solution (Figure 19). The same spectral region is presented to facilitate comparison.

