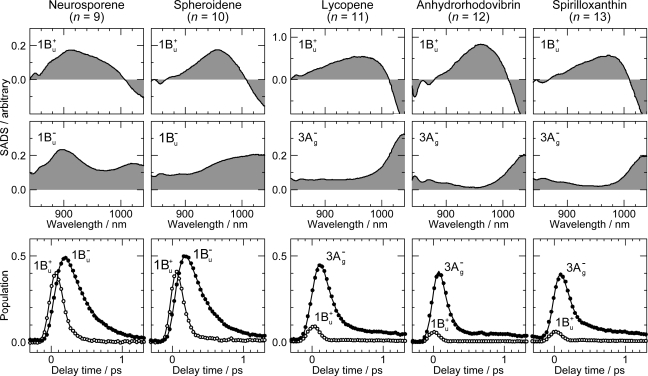
Figure 7.
Species-associated difference spectra (SADS) and time-dependent changes in population for the 1Bu+ and 1Bu− states of Cars (n = 9 and 10) and for the 1Bu+ and 3Ag− states for Cars (n = 11–13) obtained by singular-value decomposition (SVD) followed by global fitting (Reproduced from Ref. [12]).

