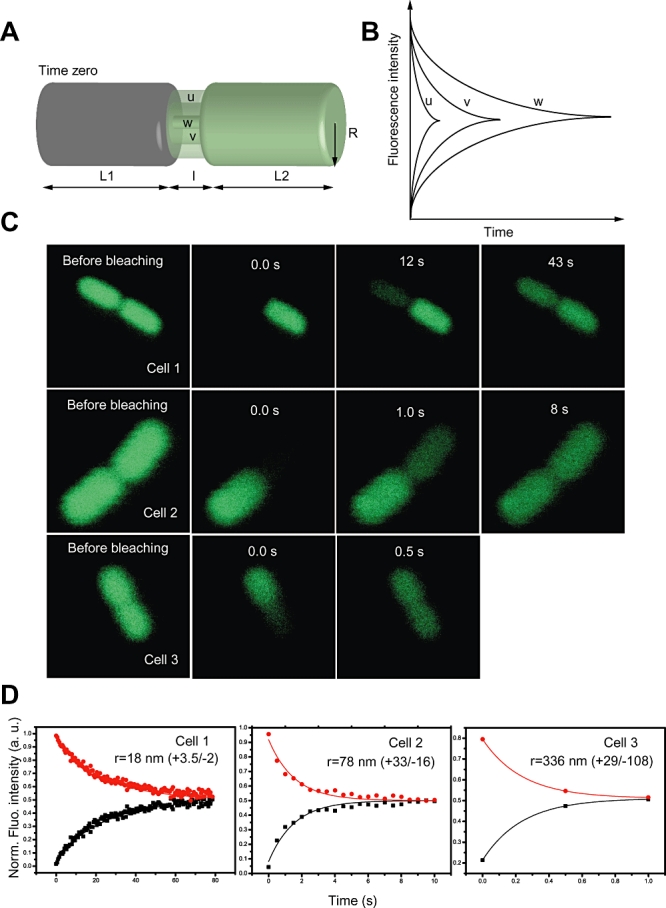
Fig. 1.

A. Schematic picture of a dividing cell with different septal radii (= u, v, w), where the EGFP content in one of the compartments is depleted by photobleaching, and where the equilibration in EGFP concentration over the compartments is then followed as a function of time after photobleaching. B. Corresponding fluorescence recovery curves. C. Consecutive images of three different dividing E. coli cells subject to a typical FRAP experiment. D. The bleach- and drift-corrected normalized EGFP fluorescence in the bleached (black) and non-bleached (red) cell volume versus time after bleaching, for the image sequences of the cells shown in panel C. The apparent ‘mirror image’ of the black and red curves is an effect of the normalization and does not appear in the raw data.
