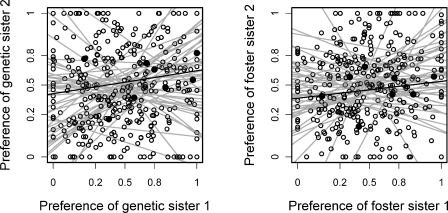
Figure 1.
Similarity in preferences between pairs of genetic sisters and pairs of foster sisters. The preferences were measured as the proportion of time spent with the focal male in a two-way choice chamber. They were normalized by angular transformation (y’= arcsine(√y)) for display and analysis, but percentage-scale labels are shown in the plots. Forty-four pairs of genetic sisters and 44 pairs of foster sisters were tested with eight sets of two males each. Regression lines are shown for each pair of sisters. The black data points and the solid black regression line highlight a typical example (one close to the population mean) for the eight pairs of trials of one pair of sisters.

