
Fig. 7.
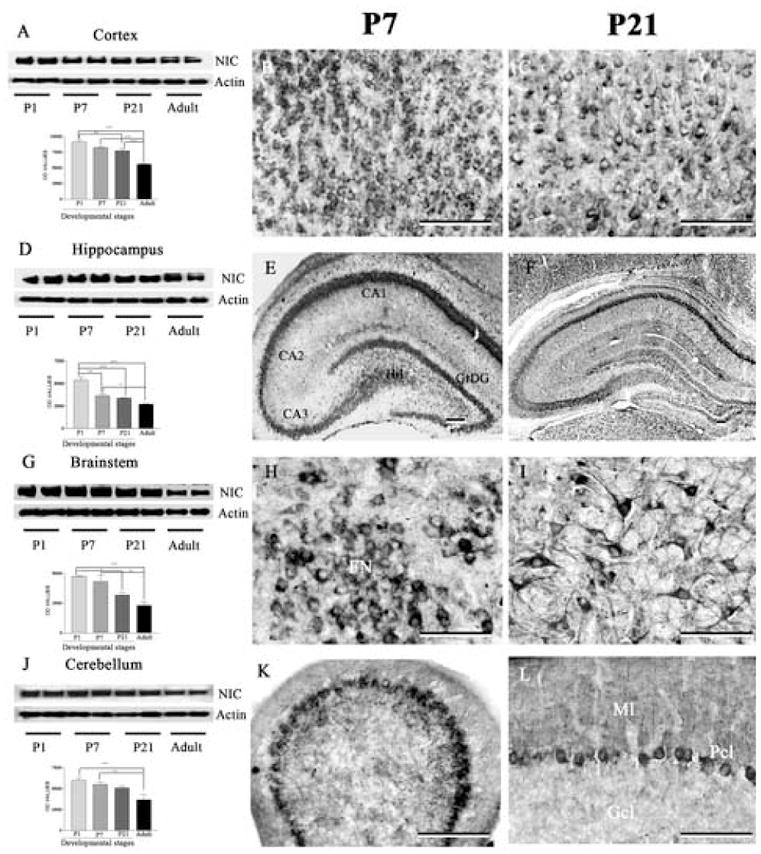
Immunoblotting and immunohistochemical staining showing the levels and expression of nicastrin in the cortex (A-C), hippocampus (D-F), brainstem (G-I) and cerebellum (J-L) of the postnatal rat brains at different stages of development. Note the gradual decrease in nicastrin levels at all four regions of the brain with the progress of the development (A, D, G, J). Immunohistochemical staining revealed that nicastrin expression is relatively high in the cortex (B, C), hippocampus (E, F), brainstem (H, I) and cerebellum (K, L) at P7 (B, E, H, K) compared to P21 (C, F, I, L) postnatal brains. All immunocytochemical photomicrographs were acquired following labeling with SP718 antiserum. Scale bar = 50 μm. * p < 0.05, ** p < 0.01, *** p < 0.001. Hil, hilus; GrDG, granular cell layer of the dentate gyrus; FN, facial nucleus; Gcl, granular cell layer; Pcl, Purkinje cell layer; Ml, molecular layer.