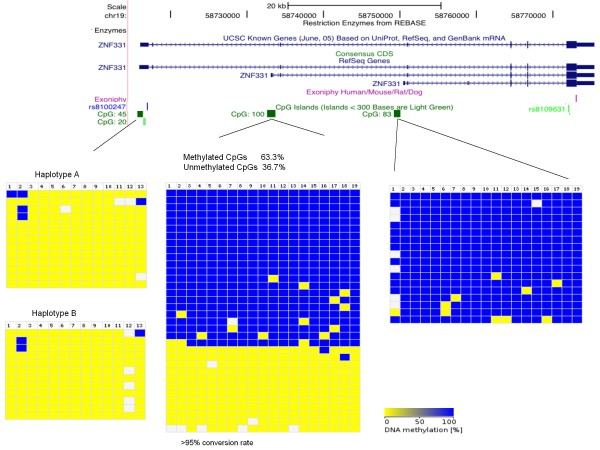
Figure 6.
Methylation levels of the CpG islands within ZNF331. The figure shows the position of ZNF331 and the CpG islands in the UCSC genome browser. In the bottom part of the figure, the methylation pattern of the three CpG islands studied is represented. Bisulphite sequencing data was compiled with the BDPC webtool [53]. The blue colour indicates metylated CpGs and the yellow colour unmethylated CpGs. Each column represents a single CpG site and each row represents one clone. The sequences for two CpGs (45 and 83) were sorted according to their genotype.

