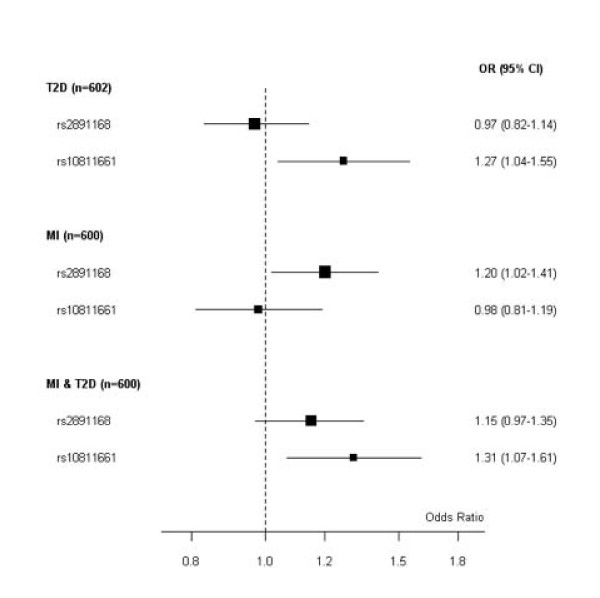
Figure 1.
rs2891168 association with MI and rs10811661 with T2D in the Italian sample. Solid squares are centered on the ORs and scaled in proportion to the inverse variance of the estimates with 95% CI (horizontal bar) for groups, comparing MI with or without a clinical history of diabetes. The reference group is non-MI, non-diabetics (605). The number of individuals in each group (n) is shown.

