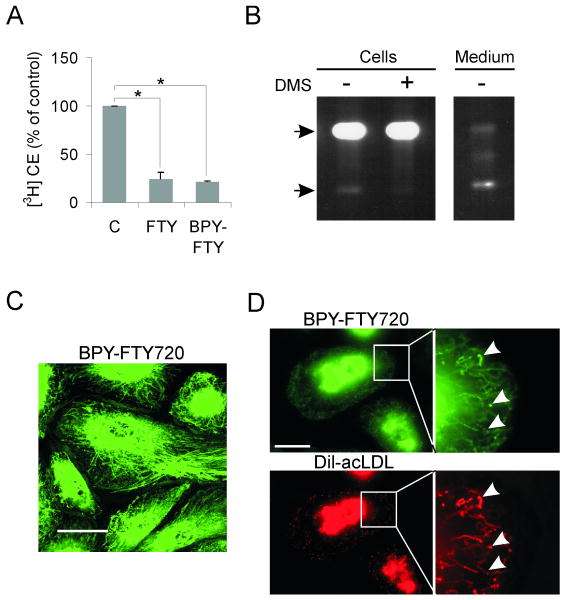
Figure 5. Cellular targeting and effects of BODIPY-FTY720.
A. Cholesterol esterification in macrophages was measured by [3H]oleic acid incorporation into cholesteryl esters. The cells were pre-treated with ± 1 μmol/L FTY720 or 1 μM BODIPY-FTY720 for 24 h, followed by a 6-h incubation with [3H]oleic acid in the presence of 50 μg/mL acLDL ± FTY720 or BODIPY-FTY720. Measurements are from three individual donors. B. Macrophages were incubated for 24 h with 1 μmol/L BODIPY-FTY720 ± 5 μmol/L DMS. Lipids from the cell pellet and from 1/8 of the medium were analyzed by TLC. The upper arrow indicates the position of BODIPY-FTY720 and the lower arrow that of BODIPY-FTY720-P. C. Macrophages were labeled with μmol/L BODIPY-FTY720 for 16 h and imaged live by confocal microscopy. A confocal section from the basal part of the cells is shown. Scale bar, 10 μm. D. Macrophages were labeled with 0.5 μmol/L BODIPY-FTY720 for 24 h followed by a 2-h pulse and a 2-h chase with DiI-acLDL. Wide field microscopy images show BODIPY-FTY720 and DiI-acLDL distribution in macrophages. The insets are composite time lapse sequences showing the movement of BODIPY-FTY720 and DiI-acLDL during 10 s (higher magnification of the area indicated). Images were acquired at a rate of 5 Hz, arrowheads indicate structures with high colocalization of BODIPY-FTY720 and DiI-acLDL. Scale bar, 10 μm.

