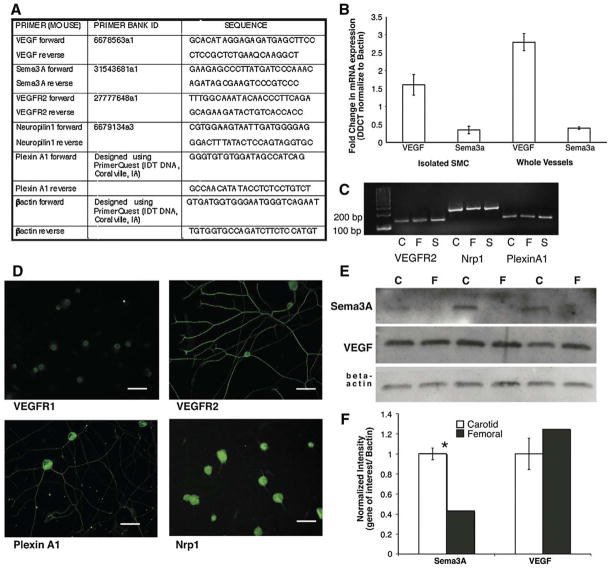
Fig. 3.
Expression of guidance cues and their receptors in vessels and SCG. (A) VEGF-A, Sema3A, VEGFR2, Nrp1 and PlexinA1 forward and reverse primer sets used for quantitative real-time PCR and RT-PCR. (B) Quantitative real-time PCR analysis of VEGF-A and Sema3A in femoral and carotid artery isolated smooth muscle cells (SMC) and whole vessels. Femoral arteries and SMC express a three-fold increase in VEGF-A mRNA compared to carotid arteries and SMC while the expression profile of Sema3A in the reciprocal. (n=3 for each gene of interest; *=p<0.05; vertical bars represent standard error.) (C) RT-PCR analysis of receptor expression in vessels and SCG. Femoral and carotid arteries as well as SCG express mRNA for VEGFR2, Nrp1 and PlexinA1. (D) Immunofluorescent analysis of VEGFR1, VEGFR2, PlexinA1 and Nrp1 in postnatal day 2 dissociated SCG neurons. Scale bar=50 μm. (E) Protein expression of guidance cues in postnatal day 2 whole vessel lysates. Representative Western blots of femoral (F) and carotid (C) artery segments identifying Sema3A and VEGF-A normalized to beta actin. (F) Quantification of Western blot data. Sema3A expression is significantly higher in carotid compared to femoral artery segments while VEGF-A expression is not significantly different between vessels (n=3 for each gene of interest; *=p<0.05; vertical bars represent standard error).

