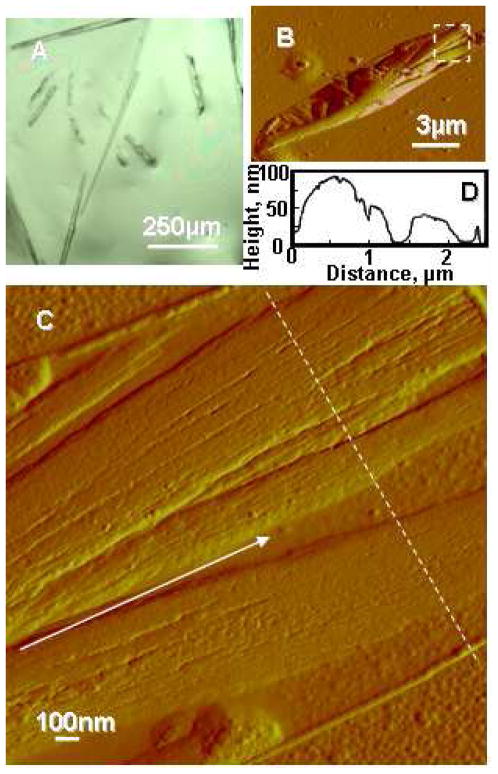
Figure 1.
Aβ fibrils before enzymatic degradation. (A) Optical microscopy image of Aβ fibrils. (B) Typical AFM amplitude image of Aβ microfibril. (C) Enlargement of white broken line in (B). Nanofibrils composing the microfibril are aligned along a white arrow. (D) Line profile data of the fibrils indicated by white broken line in (C).

