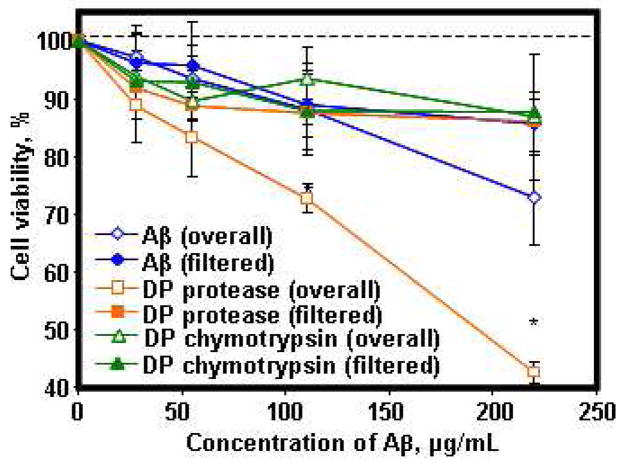
Figure 6.
Cell viability with the Aβ fibrils and their degradation fragments on differentiated PC-12 cells. Dependence of cell viability (percentage of active cells as compared to controls) on the Aβ peptides measured by MTS assay. Overall Aβ fibrils (blue open diamonds) show cell viability percentages of Aβ fibrils before the enzymatic degradation. Filtered soluble Aβ fragments (blue diamonds) shows cell viability percentages of filtered Aβ fibrils before the enzymatic degradation. Overall Degradation Products (DP) by protease XIV (orange squares) and alpha-chymotrypsin (green squares) show the percentages of each degradation products. Filtered soluble DP by protease XIV (orange open squares) and alpha-chymotrypsin (green open squares) show the percentages of each filtered degradation products. Data are represented as mean ± standard deviation (n=8). *Significant difference between two groups at p< 0.05.

