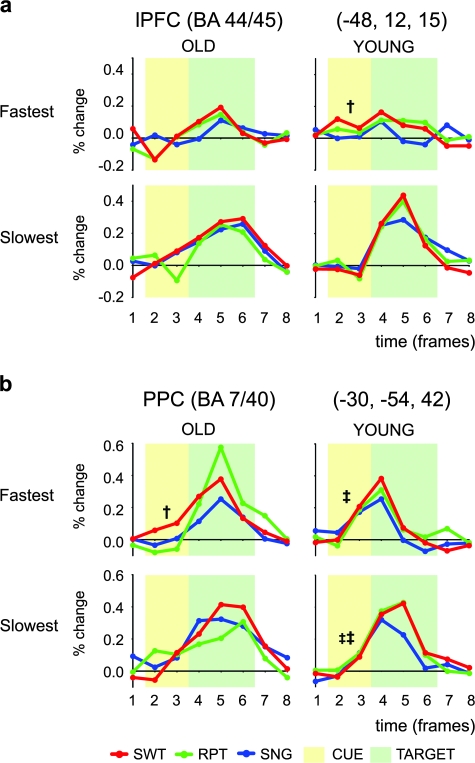
Figure 4.
Transient activity as a function of trial RT in the OLD and YOUNG group. (a) Time courses of MRI signal in lPFC estimated for fastest (upper panels) and slowest (lower panels) RT trials. (b) Time courses of MRI signal in PPC. The format is similar to that in Figure 3a. Significant cue-related activity in the switch trials is indicated by daggers (†P < 0.05) and across trial types is indicated by double daggers (‡P < 0.05, ‡‡P < 0.01).

