Figure 2.
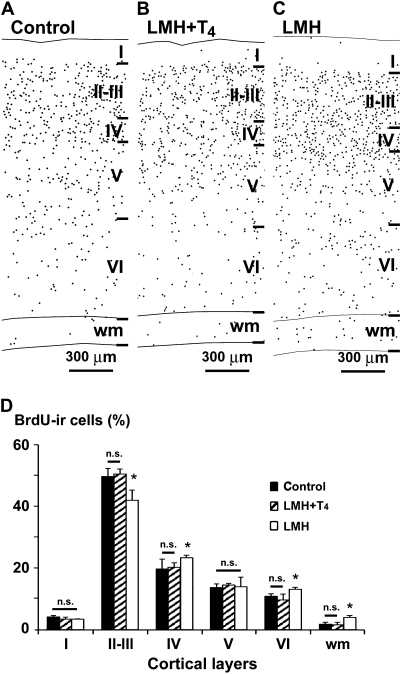
(A–C) Plots of coronal sections of the parietal cortex and hippocampus showing the distribution of type 1 and 2 BrdU-immunoreactive cells after E17–20 injections in control, LMH + T4, and LMH pups at P40. Note the increased number of heterotopic BrdU-immunoreactive cells in the wm of LMH pups compared with that of control and LMH + T4 pups. (D) Histogram showing the percentage of BrdU-immunoreactive cells in different layers of the parietal cortex in control, LMH + T4, and LMH pups (see also Supplementary Table 3). Error bars represent ± standard deviation across layers from the same group; n.s., no significant differences; *P <0.05 for LMH group compared with C or LMH + T4 group (n = 12 for each group).

