
Figure 7. Population phasic correlates of Pavlovian approach behavior.
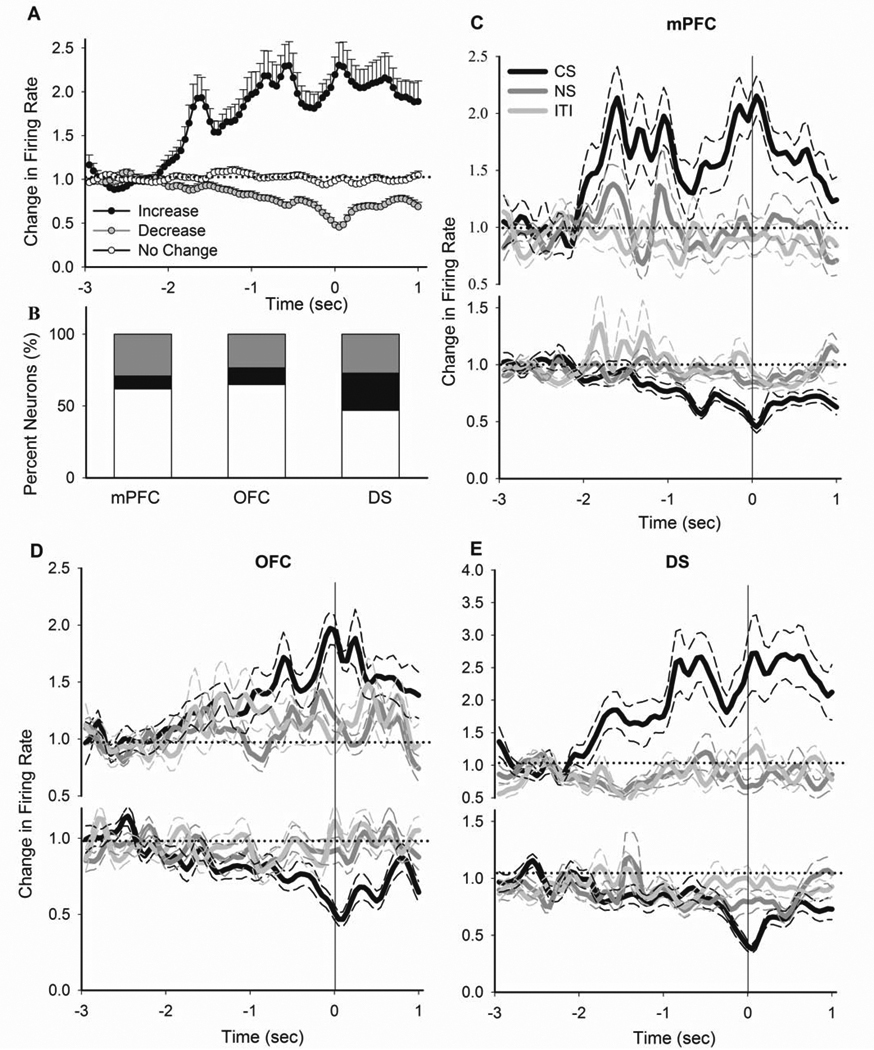
A) Average phasic activity of all neurons with an increase, decrease or no change response during Pavlovian approach behavior (CS magazine entries not immediately preceded by a nosepoke, see Methods). B) The distribution of different types of responses to magazine entry per region. C–E) Comparison of peri-entry time histograms of all neurons, which had an increase (upper panels) or decrease (lower panels) phasic response to CS magazine entries, during different epochs of PIT session. Responses are separately compared within mPFC (C), OFC (D) and DS (E). All conventions are as in Figure 4.