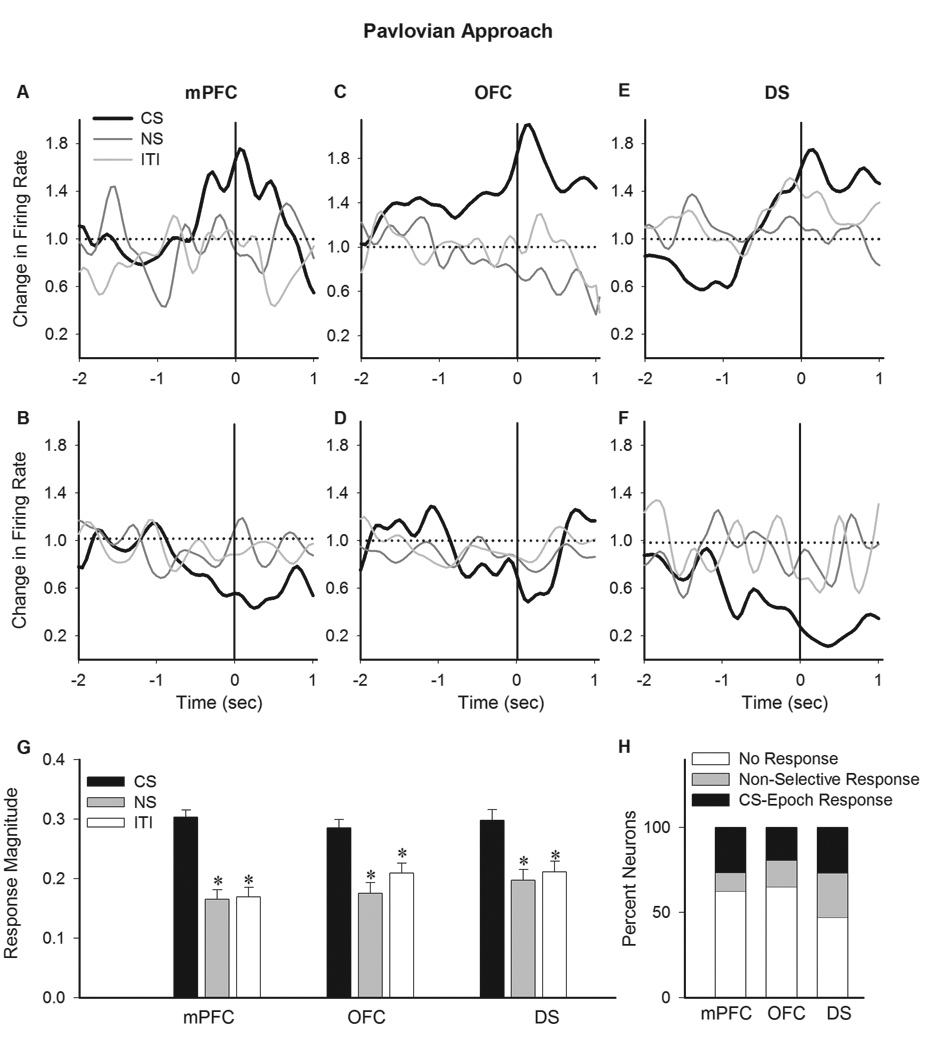
Figure 8. Individual neuronal correlates of Pavlovian Approach behavior.

A–E) Examples of individual neurons exhibiting a CS selective phasic response to Pavlovian magazine entries. Each section depicts the normalized peri-entry time histograms of two individual neurons (upper and lower panels) in mPFC (A–B), OFC (C–D) and DS (E–F). The correlates of the same behavior (magazine entry) during CS (thick black line), NS and ITI (thin gray lines) epochs have been compared within each panel. G) Average magnitude of phasic peri-magazine entry responses are compared in each region between different epochs. * p < 0.05 compared to CS. H) The distribution of neurons per region based on the profile of their individual responses to magazine entry. Units were classified based on displaying no response, non-selective response or CS epoch selective response to magazine entry. All conventions are as in Figure 5.
