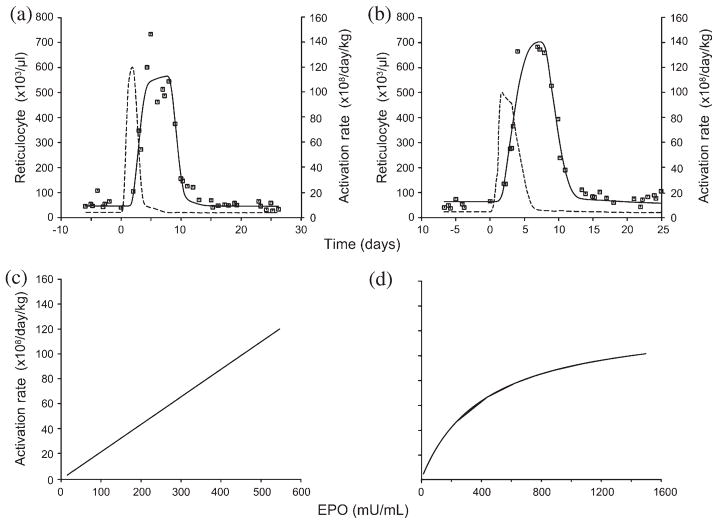
Fig. 2.
Representative plots showing (a,b) model-fitted reticulocyte response to the individual data (––, model-estimated reticulocyte responses; - - -, activation rates) and (c,d) their corresponding pharmacodynamic (PD) transduction functions. The PD model was selected based on Akaike information criteria. EPO, erythropoietin.

