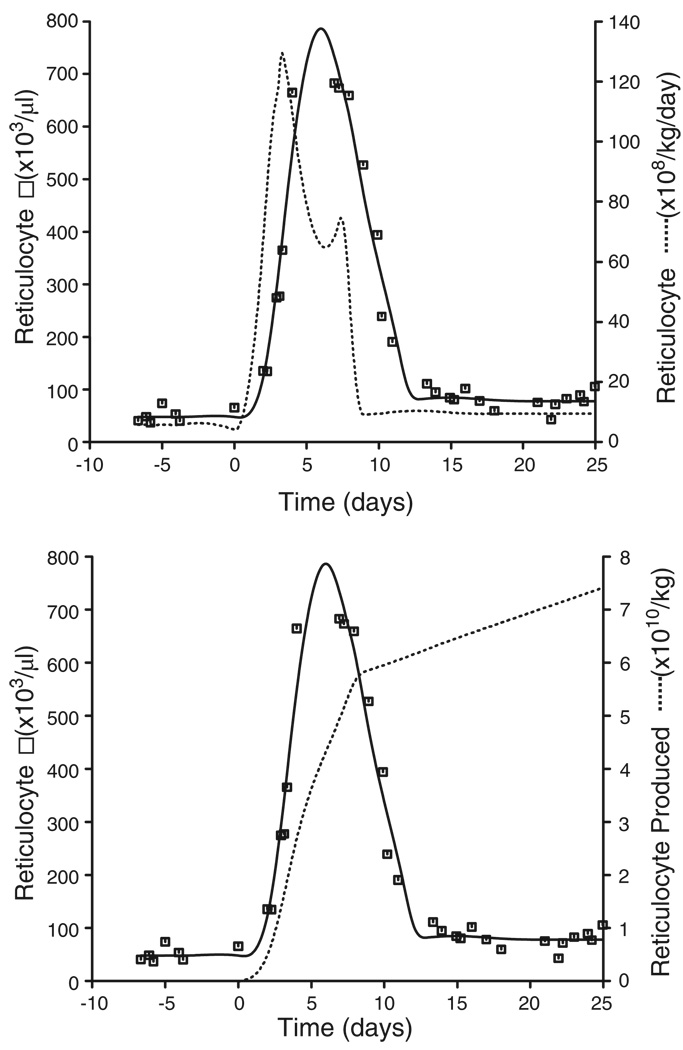
Figure 5.
Upper panel: Representative plot of the reticulocyte production rate (dashed line) obtained by deconvolution of the reticulocyte response (solid line obtained by cubic spline fitting to reticulocyte count data □). Lower panel: Representative plot of the number of reticulocytes produced obtained by integrating the reticulocyte rate curve from the upper panel for t > 0 from day 0 (dashed line)

