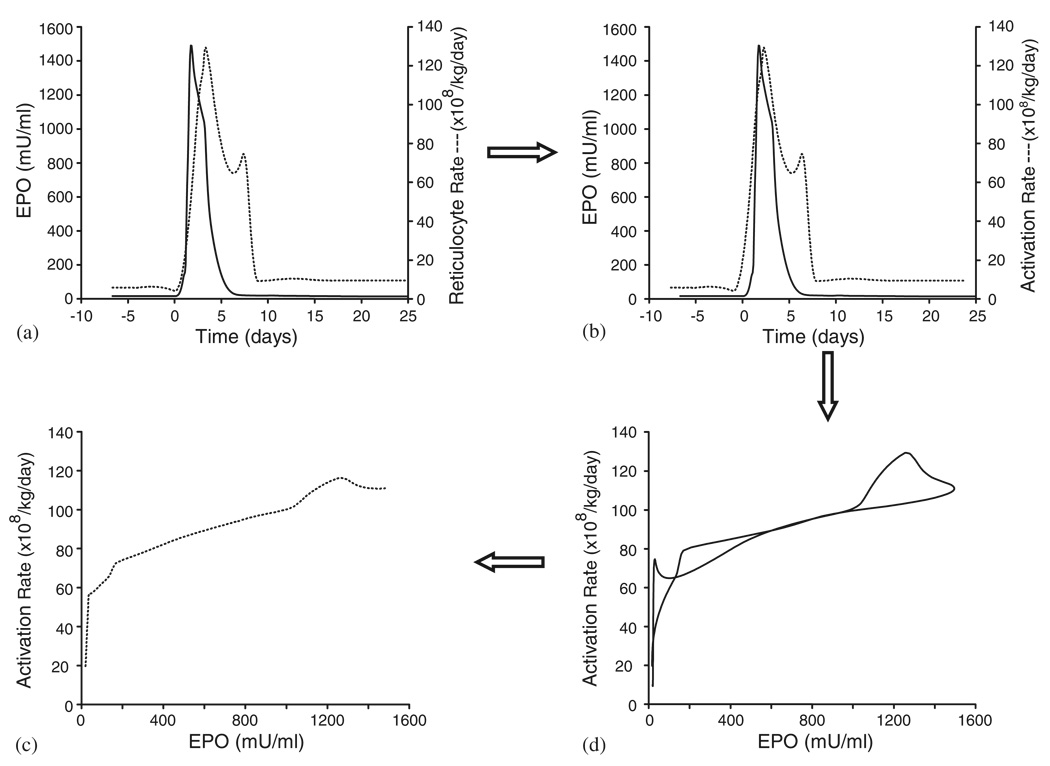
Figure 6.
(a) Representative plot of the estimated EPO curve (solid line) and reticulocyte rate (dashed line). (b) Representative plot of the estimated EPO curve (solid line) and activation rate (dashed line) obtained by shifting the reticulocyte rate curve by the estimated lag-time parameter a (1.01 days in this example). (c) Hysteresis minimization of activation rate versus EPO. (d) Transduction function of activation rate versus EPO obtained from the hysteresis plot of (c)

