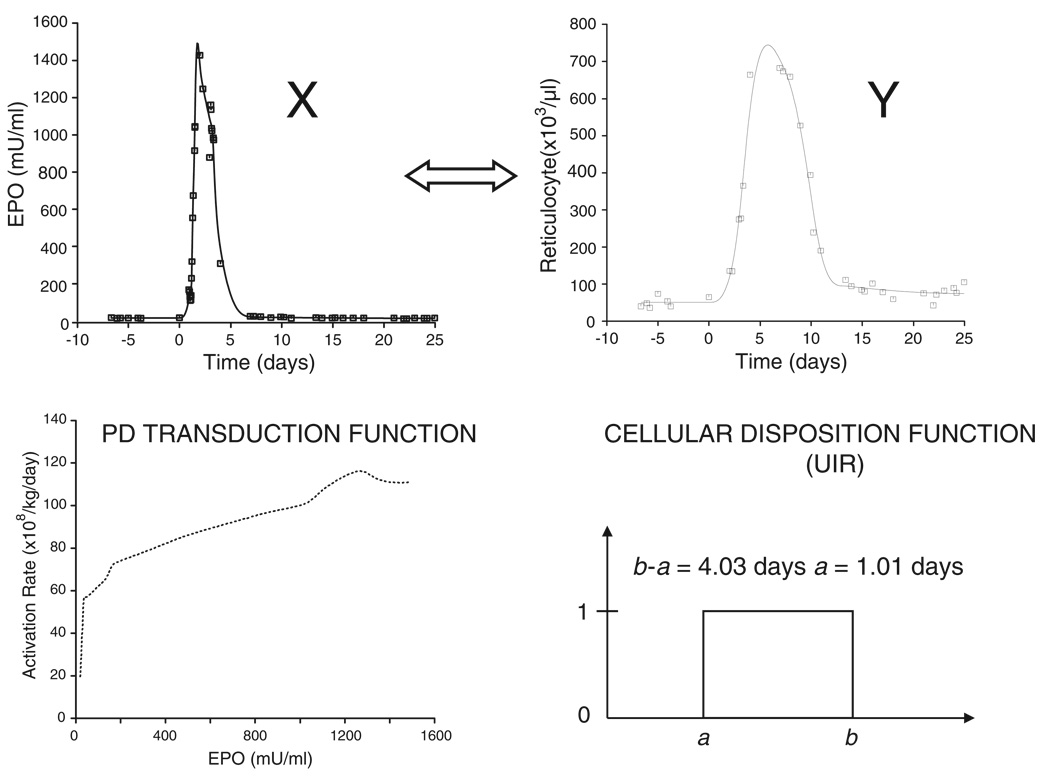
Figure 8.
Result and summary of the ‘bottom-up’ PK/PD analysis approach for a single animal. The PK response X (EPO plasma level) is mapped into a PD response Y (reticulocyte count) in a 2 step process via the determined PD transduction function followed by a convolution with the determined cellular disposition function

