Fig. 2.
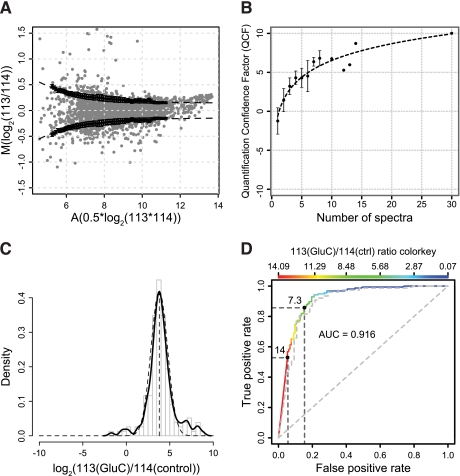
QCF and substrate ratio cutoff models. A, MA plot for reporter ion intensity ratios from a CLIP-TRAQ-TAILS experiment of secretomes from Mmp2−/− fibroblasts mixed at a 1:1 ratio without protease incubation. Black dots represent A-value dependent standard deviations calculated by averaging of 100 random sample means (n = 50) and a sliding window with size 1.5 and increment 0.1. Error bars are S.D. of the 100 random sample means. The dashed line represents a curve fitted to those values by non-linear curve fitting. This curve was used to calculate confidence factors and weights for weighted averaging of ratios for peptides identified by multiple spectra. B, increase of quantification confidence with the number of spectra used for peptide quantification. The averaged quantification confidence factor is plotted against the number of spectra used for peptide quantification. Error bars represent S.D. Data were derived from the validation experiment using Glu-C as test protease. C, distribution of abundance ratios (Glu-C/control) of spectra assigned to Glu-C-generated neo-N-termini (n = 155). The solid line represents the probability density, and the dashed line represents a fitted normal distribution with mean = 3.79 and S.D. = 0.95. The mean is an estimate for the dynamic range of CLIP-TRAQ quantification. D, ROC curve analysis of substrate classifier performance. A peptide abundance ratio (Glu-C/control) of 7.3 for cleavage events provides maximum sensitivity (86%) at a minimum false discovery rate (15%). The actual false positive and true positive rates for a ratio of 14 are ∼5 and ∼53%, respectively. The dashed line represents the same analysis for a classifier calculated from weighted averaged ratios if peptides were identified by multiple spectra. ctrl, control.

