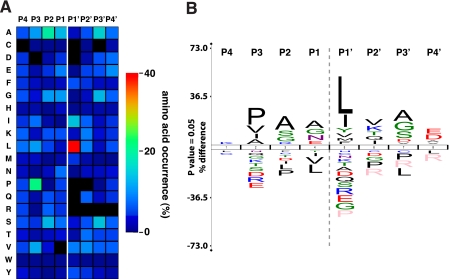
Fig. 6.
MMP-2 active site mapping. A, heat map for the amino acid occurrences in P4–P4′ for all identified MMP-2-generated neo-N-termini (n = 1,183). CLIP-TRAQ-TAILS analysis confirms the predominant MMP-2 preferences for leucine in P1′ and proline in P3 position. B, protein sequence logo calculated from the same data set applying correction for natural amino acid abundance. The logo was generated using the iceLogo software package (48).

