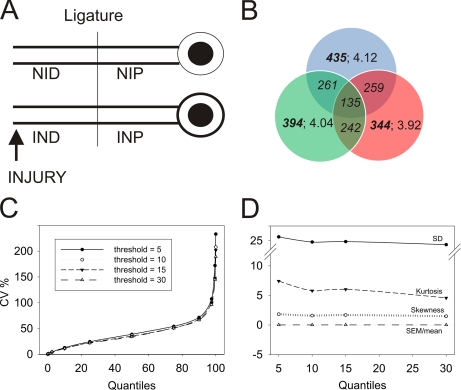
Fig. 1.
Preprocessing of iTRAQ-based peptide quantification data. A, experimental model used for this study. B, Venn diagram presenting overlap of unique proteins in three biological replicates. Bold fonts represent the total number of proteins in the group. Italics denote the number of shared proteins between the indicated replicates. Regular fonts detail the peptide per protein distribution for a specific replicate. C, distribution of CV values (%) for peptides per protein based on the iTRAQ label area (QSTAR) or intensity (Orbitrap) threshold. The graph depicts the fraction of CV values over the entire peptide per protein distribution. Proteins with at least three available peptide identifications were used for S.D. calculations. D, descriptive statistics parameters for peptide distribution per protein at the designated thresholds. S.D., S.E., skewness, and kurtosis are shown. Neither skewness nor S.E. were affected by intensity threshold change.

