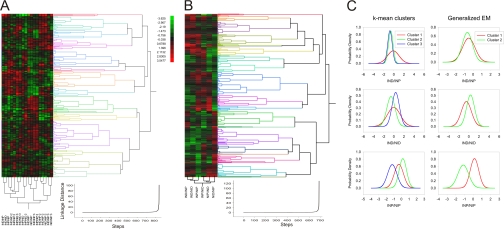
Fig. 2.
Cluster analyses of differentially represented proteins over complete data set. A, hierarchic clustering of proteins differentially represented after injury in all three experiments. Hierarchic clusters were generated using Euclidean distance estimation together with Ward's linkage method. Even spacing was used for dendrogram scaling. Clustering metrics are depicted below. Clusters were validated using root mean square deviation estimation, pseudo-F ratio, pseudo-T ratio, and Dunn's tests. B, a hierarchic cluster example for a single experiment (all procedures are as in A). C, probability density functions of non-hierarchic cluster analyses for variables IND/NIP, IND/NID, and INP/NIP in all three experiments using k-mean and expectation maximization (EM) clustering methods. Initial numbers of clusters were calculated using silhouette plot analysis. We used random seeding for k-calculation. To avoid local minima, we ran 50 replicas and chose the solution with the lowest total sum of distances over all replicas. Matlab implementation of v-fold cross-validation was used to validate correct cluster numbers with v-value set to 10.

