Fig. 3.
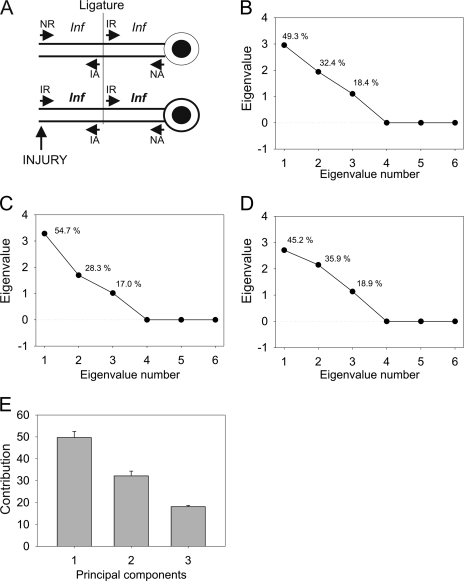
PCA analysis for iTRAQ data. A, schematic map of components contributing to protein ensembles in different compartments of the injury-ligation model. NR, non-injured retrograde; IR, injured retrograde; NA, non-injured anterograde; IA, injured anterograde; Inf, inflammation. B–D, eigenvalues and corresponding component contribution for ITRAQ ratio data for each experiment. All six variables were used for PCA. Numbers above each eigenvalue coordinate depict data variance accounted for by that eigenvalue. E, averaged eigenvalues over three biological experiments. Contribution denotes average variance accounted for by each component. Error bars denote standard error of mean.

