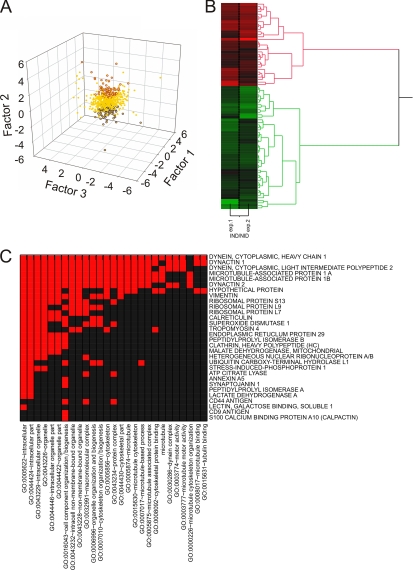
Fig. 5.
Injury-regulated retrograde transport components deduced from factor analysis. A, scatter plot of individual protein scores for all three factors. Red and blue dots represent positive and negative factor scores, respectively, correlating with the IND/NID variable. Yellow dots depict cases not correlating with IND/NID. Factor scores were obtained as a vector of data for the equation Y = μ + Lfi + ε where Y is a value of the case, μ is a population mean, L is a matrix of loadings, ε is a specific error, and f is an estimated vector of factor scores. Statistical significance was estimated with one-way Kruskal-Wallis test with post hoc Dunn's analysis; the p value cutoff was set to 0.001. B, hierarchic cluster analysis for proteins assigned to the injury-regulated retrograde transport ensemble. C, GO annotation functional category clustering for proteins up-regulated in the retrograde transport ensemble after injury. Red indicates a positive relationship; black indicates no relationship.

