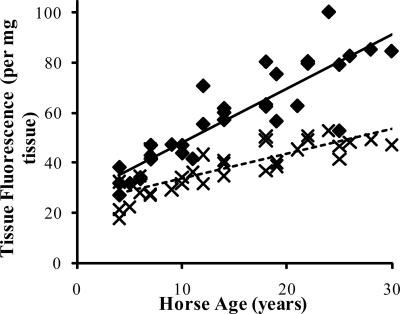
FIGURE 4.
Tissue fluorescence of the SDFT (♦) and CDET (×) as a function of horse age. A linear equation was found to give the best fit (n = 32, r = 0.88 and n = 32, r = 0.82 for the SDFT (solid line) and CDET (dashed line), respectively). Tissue fluorescence increased at a significantly lower rate in the CDET compared with the SDFT (p < 0.001).

