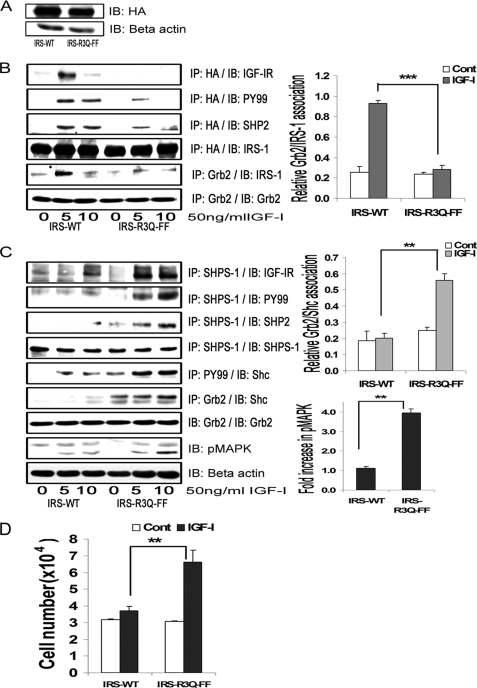
FIGURE 6.
Inhibition of IRS-1 binding to both IGF-IR and SHP-2 restores SHPS-1 phosphorylation and SHPS-1 complex assembly and enhances the cellular proliferation response to IGF-I. A, VSMCs expressing IRS-WT and the IRS-R3Q-FF mutant were serum-starved overnight and analyzed for recombinant protein expression. Cell lysates were immunoblotted (IB) for HA (top) or β-actin (bottom). B, confluent cultures of IRS-WT and IRS-R3Q-FF cells were serum-starved and then exposed to IGF-I for the indicated time periods. Cell lysates were immunoprecipitated (IP) with anti-HA and immunoblotted for IGF-IR (top panel), Tyr(P)99 (PY99; second panel), SHP-2 (third panel), or total HA (fourth panel). Cell lysates from similar experiments were immunoprecipitated with Grb2 and immunoblotted for IRS-1 (fifth panel) or total Grb2 (sixth panel). The bar graphs are representative of at least three independent experiments. Error bars, mean ± S.E. ***, p < 0.001 when the amount of Grb2 associated with IRS-1 at 5 min in response to IGF-I is compared between IRS-WT and IRS-R3Q-FF cells. C, the cell lysates from the above experiments and similar experiments were immunoprecipitated with anti-SHPS-1 antibody and immunoblotted for IGF-IR (top panel), phosphotyrosine (second panel), SHP-2 (third panel), or total SHPS-1 (fourth panel). Similarly, lysates were immunoprecipitated with Tyr(P)99 antibody and immunoblotted for p52shc (fifth panel). Similar lysates were immunoprecipitated with anti-Grb2 and immunoblotted for Shc (sixth panel) or Grb2 (seventh panel). Ten micrograms of protein from the same cell lysates was immunoblotted directly for phospho-MAPK (eighth panel) or β-actin (bottom panel). The bar graphs are representative of at least three independent experiments. Error bars, mean ± S.E. **, p < 0.01 when the amount of Grb2 associated with Shc (middle graph) or amount of phosphorylation of MAPK (bottom graph) at 10 min in response to IGF-I is compared between IRS-WT and IRS-R3Q-FF cells. D, IRS-WT and IRS-R3Q-FF cells were plated (3 × 10⁴ cells) in DMEM-HG with 2% FBS prior to exposure to IGF-I in DMEM-HG with 0.2% platelet-poor plasma. Forty-eight hours after the addition of IGF-I, cell number was determined. **, p < 0.01 when the change in number of cells proliferating in response to IGF-I is compared between IRS-WT and IRS-R3Q-FF cells. Error bars, mean ± S.E.

