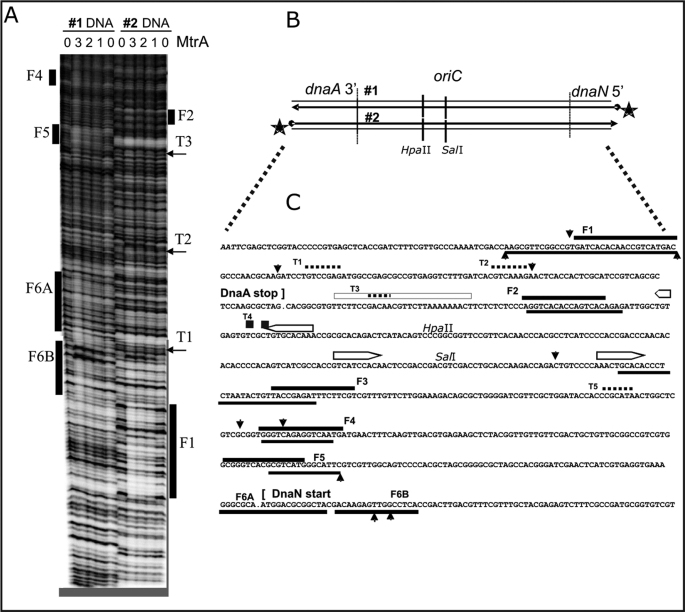
FIGURE 3.
MtrA footprint analysis in the M. tuberculosis oriC region, between 3′ dnaA and 5′ dnaN. A, two representative autoradiograms (#1 and #2) using 32P-5′-end-labeled DNA, diagrammed in B, at the 5′-end of dnaN (#1) and the 3′-end of dnaA (#2). Purified His-tagged MtrA protein was phosphorylated as described in Fig. 2, prior to the DNase I protection footprint analysis, also detailed under “Materials and Methods.” The numbers (0, 1, 2, 3) above the lanes indicate that either 0, 10, 20, or 30 μl of the MtrA (2 mg/ml protein) was added to the standard 200-μl binding reactions. Similarly aligned bars and arrows mark the footprints (F1, F2, … F6A, F6B) and shorter toe prints (T1, T2 …) that are described in the text and aligned with the DNA sequence in C. B, schematic diagram of the M. tuberculosis oriC region is aligned with the 32P-end-labeled DNA (#1 and #2) used in A. The indicated HpaII and SalI sites also served as positions for 32P-end-labeled DNA used in additional footprint experiments not shown. C, summary of MtrA footprint analysis in the M. tuberculosis oriC region. These DNA sequences correspond with the above oriC schematic in B and with the footprints in A. It also summarizes footprint experiments (using internally labeled HpaII and SalI sites) that are not shown. The open bars with pointed ends mark established DnaA-boxes (9). Solid bars mark the footprints (F1, F2, … F6A, F6B), and dotted lines mark the shorter toe prints (T1, T2 …). Perpendicular arrowheads mark the prominent DNase I cut sites that are enhanced by MtrA. When positioned below the presented DNA sequences, these lines and arrows indicate the sequences protected or cleaved on the corresponding bottom strand.

