FIGURE 1.
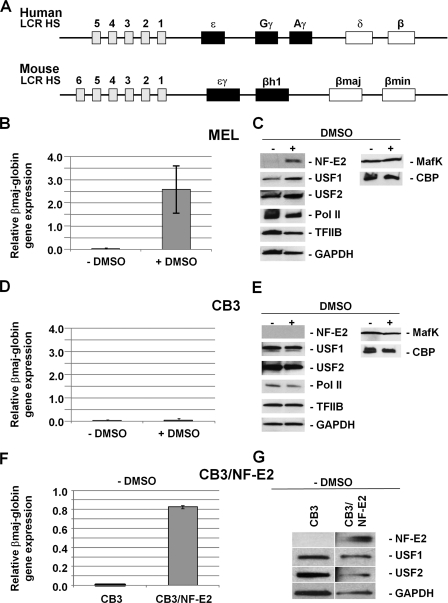
DMSO mediated increase in USF, NF-E2 (p45), and β-globin expression in MEL but not CB3 cells. A, structure of the human and mouse β-globin gene loci. The β-globin gene loci consist of five (human) or four (mouse) genes that are expressed during development. The murine ϵγ- and βh1-globin genes are expressed in embryonic erythroid cells, and the βmin- and βmaj-globin genes are expressed in fetal and adult erythroid cells (70). The human ϵ-globin gene is expressed at the embryonic stage, the Gγ- and Aγ-globin genes are expressed at the fetal stage, and the δ- and β-globin genes are expressed at the adult stage. All of the genes are regulated by an LCR located far upstream of the genes and composed of several erythroid-specific HS sites. B, quantitative RT-PCR analysis of βmaj-globin gene expression in MEL cells incubated with or without 1.5% DMSO for 3 days. RNA was isolated from MEL cells, reverse transcribed, and subjected to qPCR using primers specific for the adult βmaj-globin gene. The results are shown as the relative expression normalized to transcription of the β-actin gene. Error bars, S.E. from three independent experiments. C, Western blotting analysis of NF-E2 (p45), USF1, USF2, Pol II, TFIIB, GAPDH, MafK, and CBP in MEL cells incubated with or without 1.5% DMSO for 3 days. Proteins from whole cell extracts (60 μg) were electrophoresed in 4–20% Ready Gels (Bio-Rad), transferred to nitrocellulose membranes, and incubated with antibodies as indicated. D, quantitative RT-PCR analysis of βmaj-globin gene expression in CB3 cells incubated with or without 1.5% DMSO for 3 days. RNA was isolated and analyzed as described in B. E, Western blotting analysis of NF-E2 (p45), USF1, USF2, Pol II, TFIIB, GAPDH, MafK, and CBP in CB3 cells incubated with or without 1.5% DMSO for 3 days. Proteins were processed and analyzed as described in C. F, quantitative RT-PCR analysis of βmaj-globin gene expression in CB3 and CB3/NF-E2 cells. RNA was processed and analyzed as described in B. G, Western blotting analysis of NF-E2 (p45), USF1, USF2, and GAPDH expression in CB3 and CB3/NF-E2 cells. Proteins were processed and analyzed as described in C.

