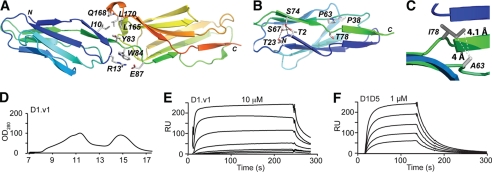
FIGURE 2.
Isolation of a functional ICAM-1 D1 by directed evolution. A, ICAM-1 D1D2 (PDB code 1IAM (28)) is drawn in a schematic representation (PyMOL, DeLano Scientific LLC) with the residues at the domain interface shown in sticks. N and C termini are labeled. B, ICAM-1 D1 is shown with the wild-type residues drawn in sticks displayed for the positions where mutations were found. H-bond networks are shown with dotted lines. C, shown is a schematic diagram of ICAM-1 D1 with modeled van der Waals interaction after the mutations of P63A and T78I. D, ICAM-1 D1.v1 elution from Superdex-75 size exclusion column is shown. E–F, SPR measurement of the binding of the ICAM-1 D1.v1 (E) and D1-D5 (F) to the high affinity LFA-1 I domain immobilized on the chip is shown. RU, relative units. ICAM-1 was injected over the chip in a series of 2-fold dilutions, starting from the indicated concentrations.

