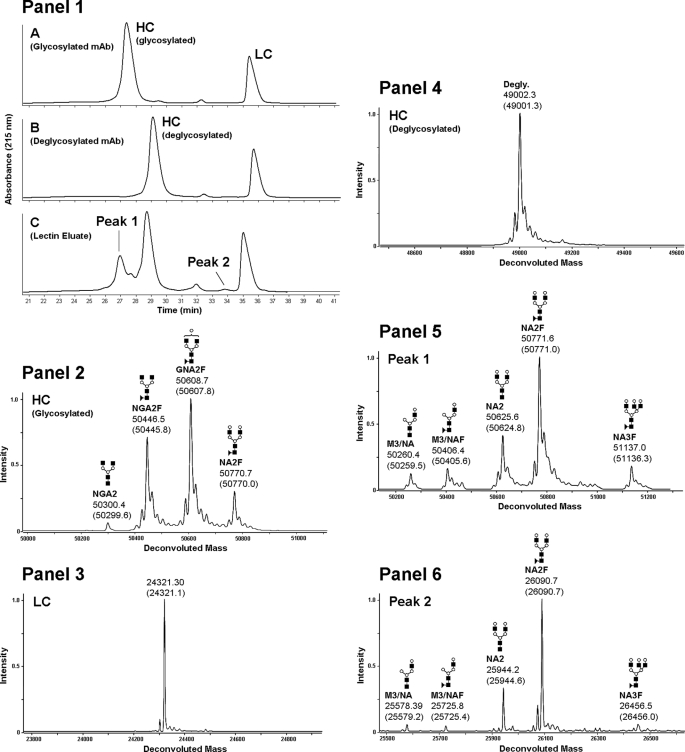
FIGURE 1.
Reduced mass analysis of glycosylated, deglycosylated, and lectin-enriched recombinant human IgG2 antibody. The UV chromatogram of the reversed phase separations of reduced glycosylated, deglycosylated, and lectin-enriched antibody samples are shown in Panel 1, A–C, respectively. The glycosylated HC mass spectrum is shown in Panel 2, the light chain mass spectrum is shown in Panel 3 and the deglycosylated antibody HC spectrum is shown in Panel 4. The lectin-enriched antibody HC mass spectrum from reversed phase peak 1 (Panel 1, C) is shown in Panel 5 and the lectin-enriched antibody LC mass spectrum from reversed phase peak 2 (Panel 1, C) is shown in Panel 6. The theoretical masses for each species are listed in parenthesis below the observed masses.

