FIGURE 2.
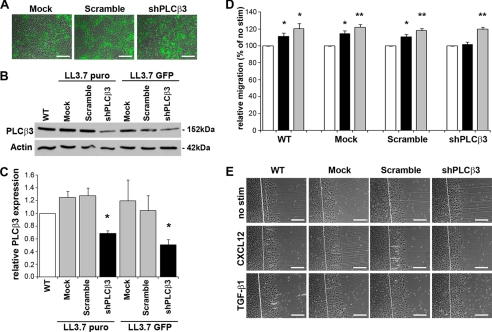
PLCβ3 depletion blocks CXCL12-stimulated IEC-6 cell migration. A, fluorescence microscopy indicated equivalent transduction of lentiviral particles encoding GFP (green) and either rat-specific shRNA against PLCβ3, a Scramble sequence, or empty control vector (Mock) in IEC-6 cells. Data are representative GFP-fluorescence and phase-contrast overlay images. B, immunoblot analysis revealed that endogenous levels of protein were significantly depleted within shPLCβ3-targeted cells relative to Scramble and Mock transduced cells. C, densitometric analysis of PLCβ3 protein levels. Wild-type (WT) IEC-6 cells (white), control Scramble and Mock cells (gray), and shPLCβ3 cells (black) from LL3.7-puro or LL3.7-GFP lentiviral vectors. Data are the ratio of PLCβ3 protein levels relative to actin loading control. *, the significant knockdown of PLCβ3 compared with WT cells (p ≤ 0.05). Values in C are mean ± S.E. of three experiments. D, IEC-6 cell migration in PLCβ3 knockdown cells. IEC-6 cell migration was assessed 18 h after wounding and stimulation with 20 ng/ml CXCL12 (black bars) or 5 ng/ml TGF-β1 (gray bars). CXCL12-stimulated migration was decreased in shPLCβ3 knockdown cells and not significantly different from untreated control cells (white bars). Data are expressed as percentage of basal migration in unstimulated (no stim) control cells. *, significant difference (p ≤ 0.05); **, significant difference (p ≤ 0.01). Values are mean ± S.E. from four experiments. E, representative wound images from lentiviral transduced cells. Scale bar, 200 μm.

