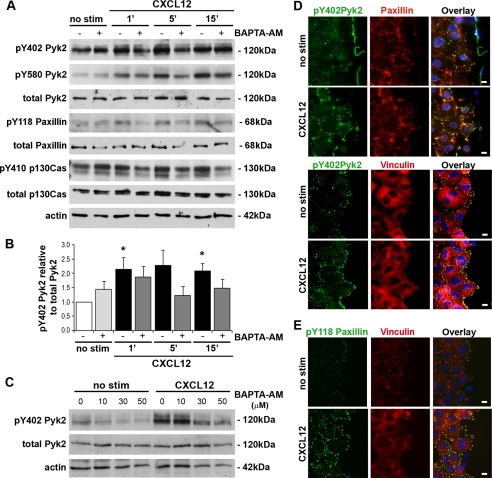
FIGURE 4.
CXCL12 stimulates Pyk2 phosphorylation and localization at focal adhesions. A, immunoblot analysis of IEC-6 cells indicated that CXCL12 (20 ng/ml) stimulated phosphorylation of Pyk2 tyrosine residues 402 (pY402) and 580 (pY580). Pretreatment with 10 μm BAPTA-AM (+) or PBS (−) revealed that chemokine-stimulated Pyk2 phosphorylation was variably decreased by the calcium chelator. CXCL12-stimulated phosphorylation of paxillin tyrosine 118 and p130Cas tyrosine 410 was also blocked by pretreatment with BAPTA-AM. Total Pyk2, paxillin, p130Cas, and actin were detected as loading controls. Data are representative of three separate analyses. B, densitometric analysis of Pyk2 phosphorylation. CXCL12-stimulated Pyk2 phosphorylation (black bars) was reduced by pretreatment with 10 μm BAPTA-AM (dark gray bars). *, a statistically significant difference (p ≤ 0.05) between CXCL12-stimulated Pyk2 phosphorylation relative to control (no stim) cells (white bar). Data are relative densitometric units normalized to total protein. Values are mean ± S.E. of three experiments. C, immunoblot analysis of IEC-6 cells pretreated with increasing concentrations of BAPTA-AM (0, 10, 30, or 50 μm) showed the dose-dependent inhibition of 5-min CXCL12-stimulated phosphorylation of Pyk2. Data representative of three separate analyses. D, localization of active Pyk2 in CXCL12-stimulated monolayers. Antibodies specific for Pyk2 (pY402), paxillin, or vinculin were used to define protein localization in wounded IEC-6 control cells (no stim) or cell monolayers 5 min after CXCL12 stimulation. Overlay images indicate co-localization (yellow) of active Pyk2 (green) with paxillin (top, red)- or vinculin (bottom, red)-defined focal adhesions. E, levels of active paxillin were increased after 15-min CXC12 stimulation. Antibodies specific for paxillin (pY118) or vinculin were used to define protein localization in wounded IEC-6 control (no stim) or CXCL12-stimulated cells. Overlay images indicate co-localization (yellow) of active paxillin (green) with vinculin (red)-delimited focal adhesions. Immunofluorescence images are representative of three or four independent experiments. Scale bar, 10 μm.

