FIGURE 7.
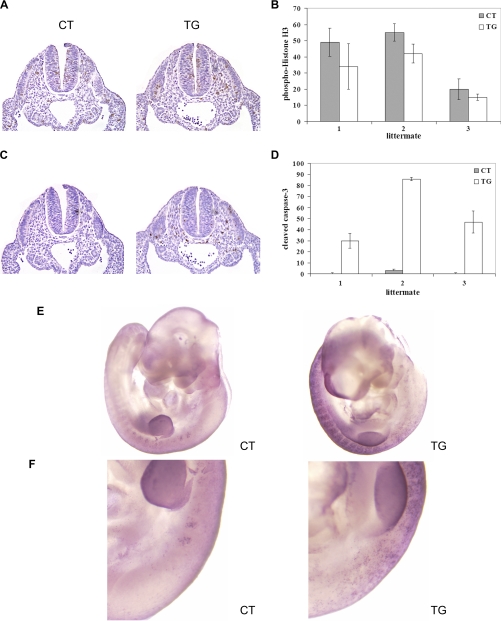
A, immunohistochemical staining of phosphohistone H3 (Ser10), a mitosis marker, on transverse sections of E9.5 control (CT) and transgenic (TG) littermates (magnification, ×10). B, graphical presentation of phosphohistone H3-positive cells in the sclerotome from serial sections of control and transgenic littermates (n = 3). Error bars, S.D. C, immunohistochemical staining of cleaved caspase-3, a marker for apoptosis, on transverse sections of E9.5 control and transgenic littermates (magnification, ×10). D, graphical presentation of cleaved caspase-3-positive cells in the sclerotome from serial sections of control and transgenic littermates (n = 3). E, whole-mount TUNEL staining of E10.5 control and transgenic littermates (n = 3). The forelimb region is shown in F. The upper side is anterior, and apoptotic nuclei appear as dark blue dots.

