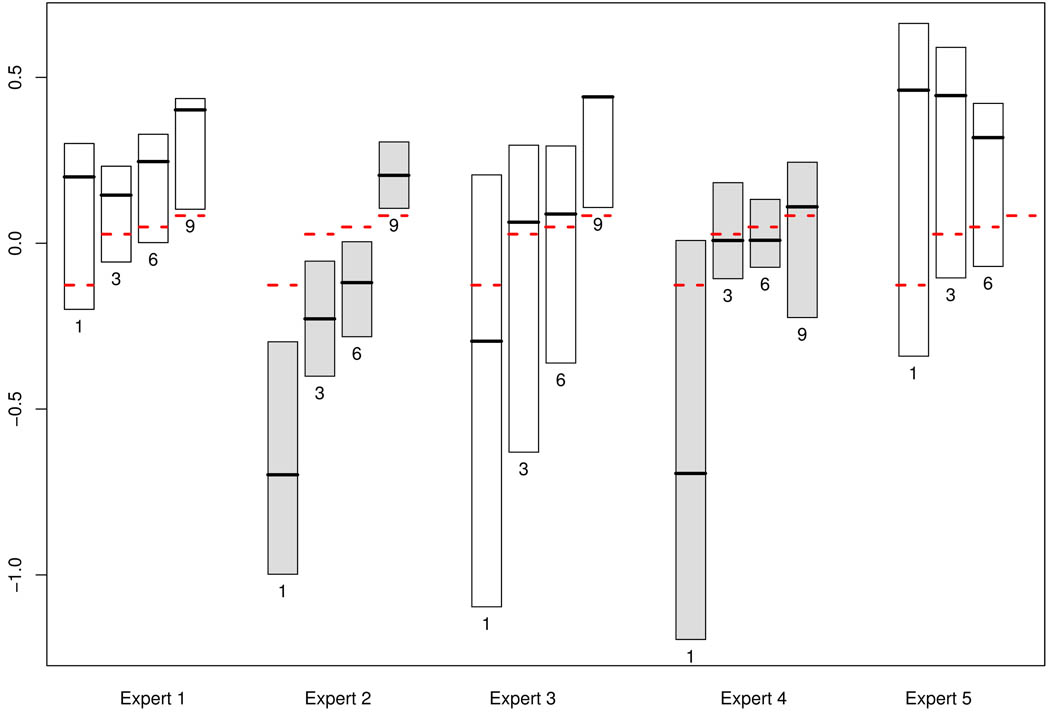
Figure 1.
Prior distributions provided by Experts 1–5 for the slope of the Resident Sharing, Support & Enthusiasm score for those clients whose last assessments were at 1, 3, 6, and 9 months, as noted beneath each box. Prior mode is provided by the dark solid line, the box width reflects the difference between the upper and lower bounds, and the dashed lines are the posterior mean slopes from the data analysis. (Expert 5’s 9-month assessment (far-right hand side) is missing.)

