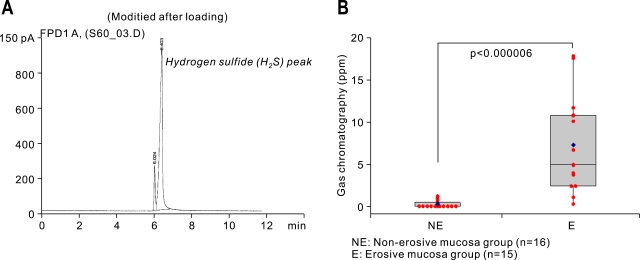
Fig. 2.
VSC concentrations in NE and E groups measured with gas chromatography (in ppm). (A) Gas chromatography with a flame photometric detector (Agilent 6890N, Willington, DE) used for measuring VSCs in aspirated gastric juices. The figure is a representative chromatograph showing the hydrogen sulfide (H2S) peak. (B) Comparison between changes in the NE and E groups (Box and bar denote mean and SD values, and blue dot denotes the median value in each group).

