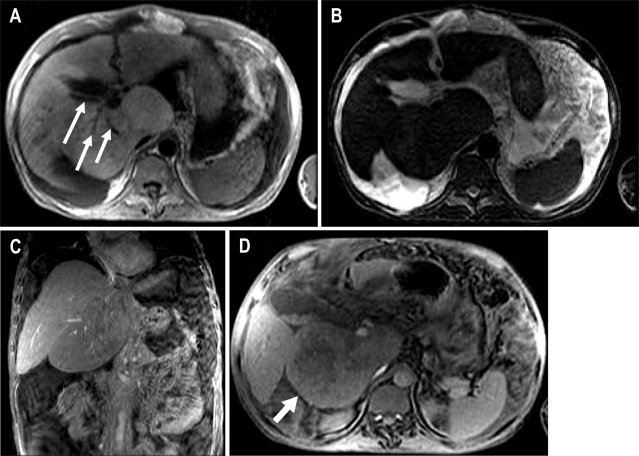
Fig. 1.
(A) Postcontrast CT (arterial phase) shows large, low attenuated mass (12×6 cm sized) in the caudate lobe (arrow). It shows no arterial enhancement. (B) Postcontrast CT (portal phase) shows that the mass like lesion of caudate lobe dose not contained a portal branch. (C) Coronal T2 weighted magnetic resonance image shows isointensity of the caudate lobe. (D) T1 weighted magnetic resonance image shows hyperintensity of the caudate lobe.

