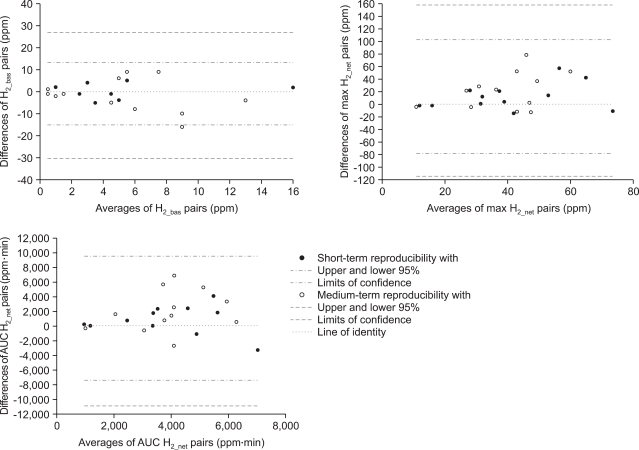
Fig. 2.
Bland and Altman statistics (plot of differences between pairs vs. their means) of the short-term (filled circles) and medium-term (open circles) reproducibilities of parameters characterizing hydrogen breath excretion after a p.o. lactulose load.
H2_bas: basal fasted hydrogen; max H2_net: maximum net increment over baseline; AUC H2_net: area under the curve of the net increment of hydrogen; the respective borders of the 95% confidence intervals are plotted in each panel (cf. the legend in the bottom panel).

