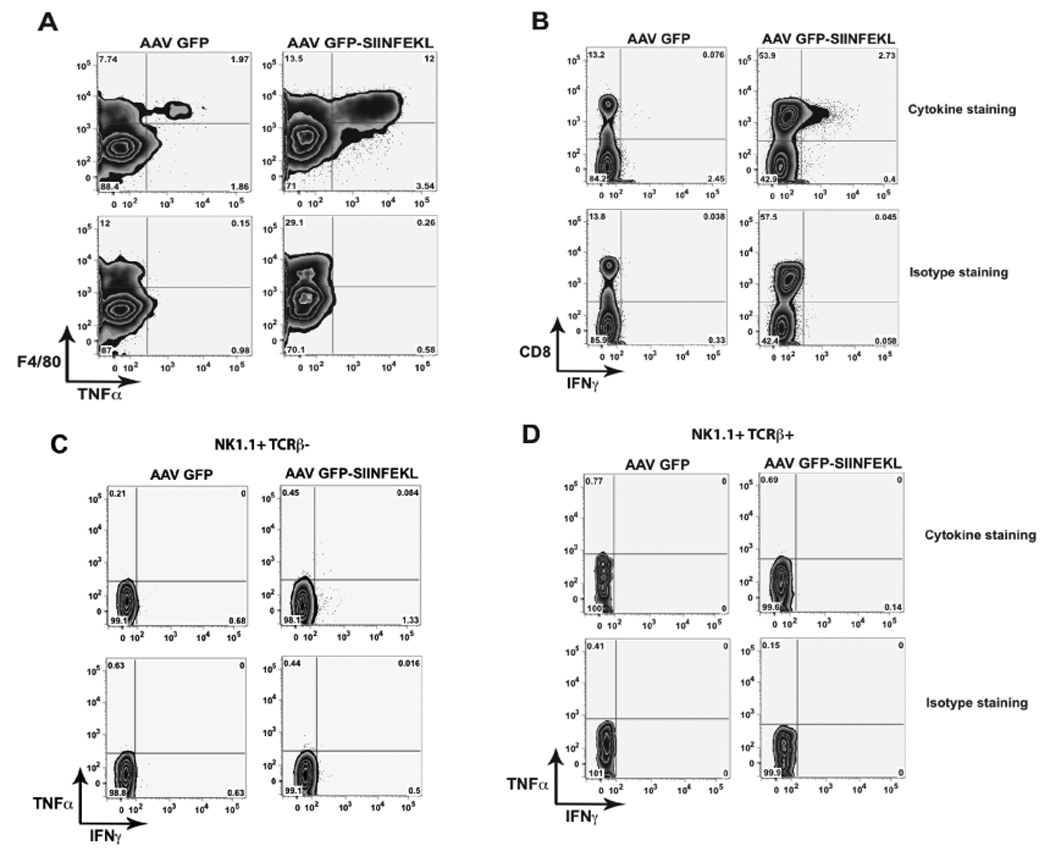
Figure 5. Cytoplasmic staining for IFNγ and TNFα.

Liver lymphocytes isolated on day 3 from mice treated with rAAV2 vectors and OT-1 T-cells as described in Figure 1, were restimulated in media with 70 U/ml IL-2, 10 µg/ml SIINFEKL peptide, and 1 µl/ml GolgiPlug-BD for 4–5 hours. Lymphocytes were stained for cell identification markers and TNFα (A) and IFNγ (B). Cytokine expression in NK1.1+ TCRβ− (C) or NK1.1+ TCRβ+ cells (D). Data are representative of 3 separate experiments.
